
Airlines
Air cargo metrics: tonnes, CTK, ACTK and load factor
A practical calculation shows why cargo weight, transport work and capacity measure different things.

Desk
Strategy, operations, economics and partnerships shaping airlines across international markets.
A worked example for comparing capacity, traffic and occupancy without confusing passengers with profit.
Banks of arrivals and departures create thousands of city pairs—but also concentrate pressure into short windows.
Departure and arrival punctuality use different moments; thresholds, cancellations and schedule buffers can change the comparison.
A practical calculation shows why cargo weight, transport work and capacity measure different things.
An order, a completed aircraft and a plane carrying passengers are different milestones.
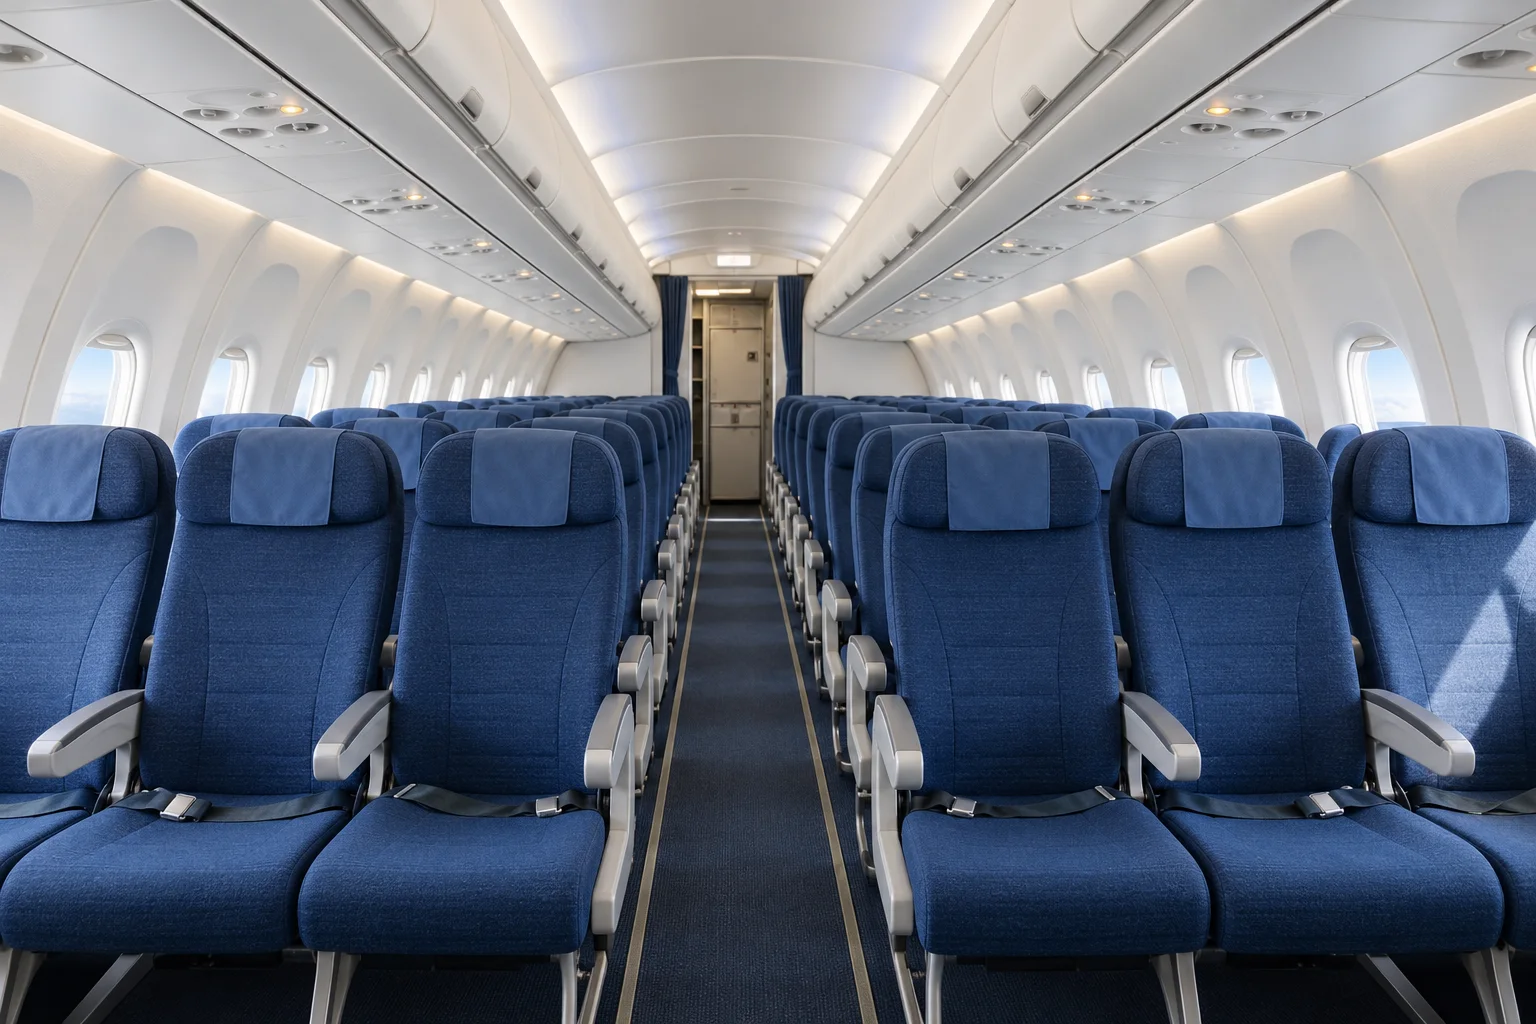
A worked example for comparing capacity, traffic and occupancy without confusing passengers with profit.

Departure and arrival punctuality use different moments; thresholds, cancellations and schedule buffers can change the comparison.
Passenger aircraft carry cargo in their lower holds, making flight schedules and fleet choices part of the freight network.
A delayed flight can affect aircraft, crews and passengers across a network.
A single itinerary can involve several airlines, but the agreement behind it changes who sells, operates and supports each flight.
An aircraft can carry one airline’s flight number while another company supplies the aircraft, crew, maintenance and insurance.
Fleet, route and technology announcements traced to accessible source material.
Banks of arrivals and departures create thousands of city pairs—but also concentrate pressure into short windows.
Airlines
An aircraft order matters only in the context of delivery dates, retirement plans, airport constraints and the routes the carrier can profitably serve. An announced route is a plan until schedules and operating permissions are confirmed.
A codeshare changes the flight number on a ticket; a wet lease can change the company operating the aircraft. Check the operating carrier, baggage conditions and connection protection before comparing offers.
No. Occupancy, yield and cost measure different things. Compare reporting periods, route distance and financial scope; separate passenger RPK/ASK from cargo CTK/ACTK. A full flight can still lose money.
Use the same event, threshold, period and treatment of cancellations. Gate arrival and runway landing are different timestamps. An on-time percentage without its denominator and exclusions is insufficient for a fair comparison.